Dashboard
Before this page
Assumes you have read The app at a glance. Brand new? Start at The words you need first.
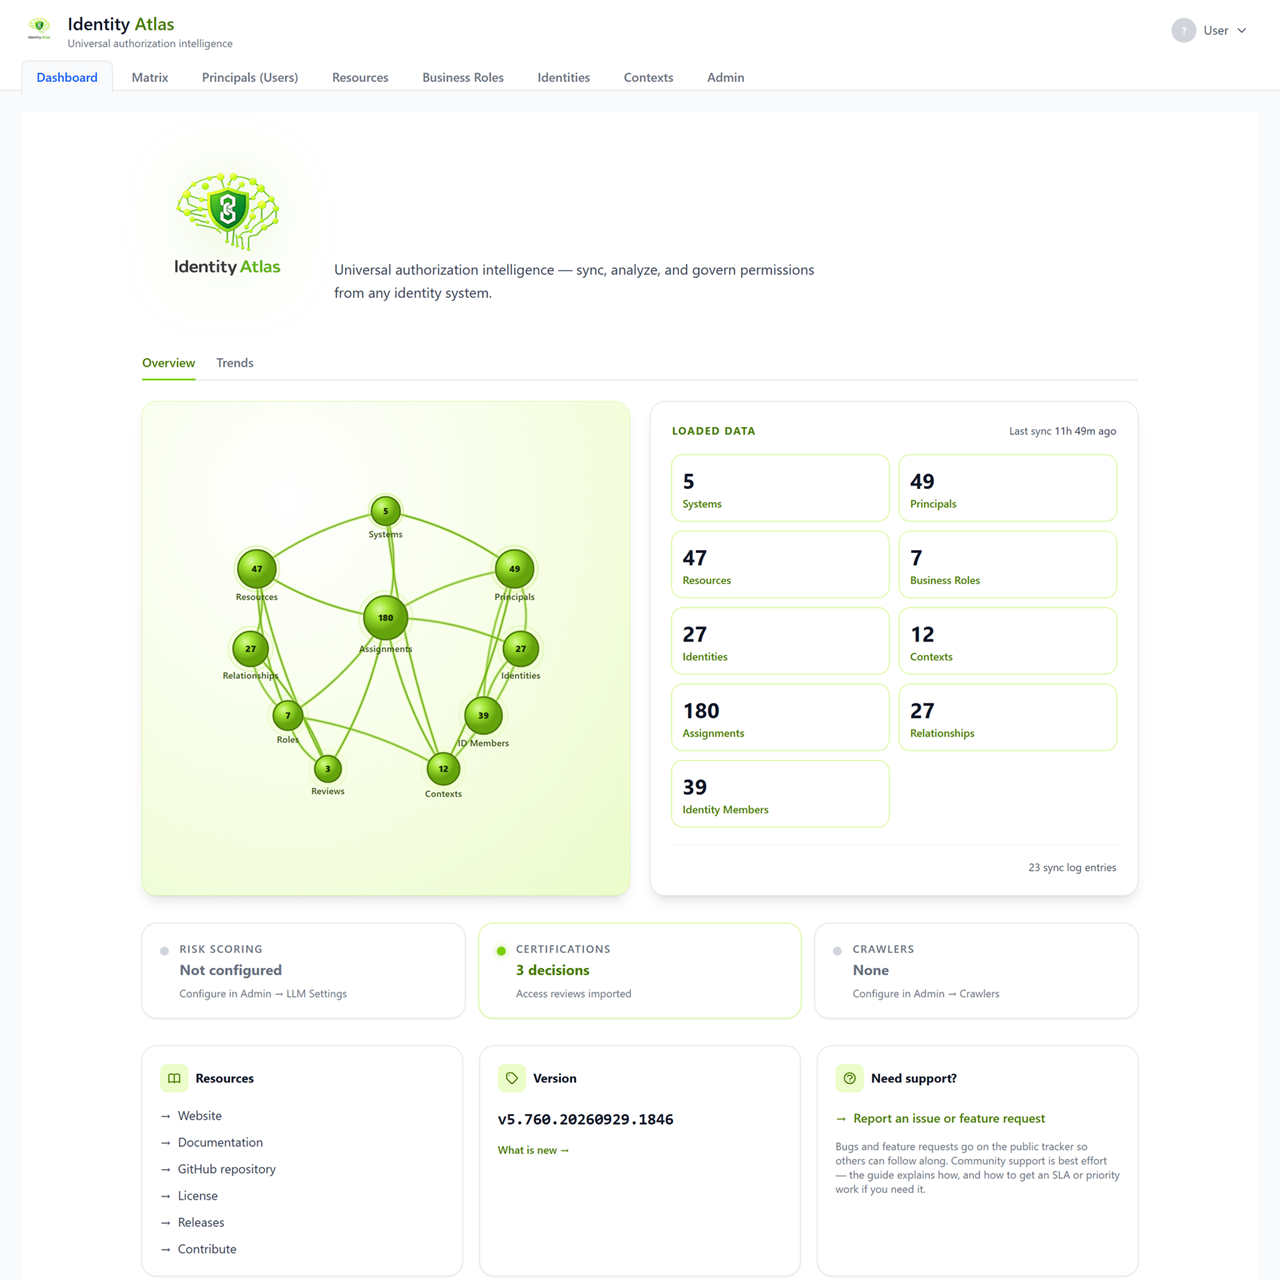
The Dashboard is the landing page — the first thing you see when you open Identity Atlas. It's a one-shot overview of what's loaded, whether the key features are configured, and where to go next. It has two tabs: Overview (described here) and Trends (daily time-series charts, covered in Dashboard Trends).
Reading the Overview
The brain graph
The left panel is a brain-shaped network graph that echoes the Identity Atlas logo. Each node is an entity type — Systems, Principals, Resources, Roles, Identities, Contexts, Assignments, Relationships, ID Members, and Reviews — and its number is the current count. Nodes that hold data glow and pulse in lime green with the connections between them animated; empty types stay dim. Node size scales (on a log scale) with the count, so a system with millions of assignments doesn't dwarf one with dozens. It's decorative, but it gives an at-a-glance sense of how full and how connected your data is.
Loaded data (entity counts)
The right panel lists the live counts for every entity type:
| Card | Opens |
|---|---|
| Systems | Systems list |
| Principals | Principals/Users list |
| Resources | Resources list |
| Business Roles | Business roles / access packages |
| Identities | Identities list |
| Contexts | Contexts |
| Assignments | — (count only) |
| Relationships | — (count only) |
| Identity Members | Identities list |
Cards with data are clickable and jump straight to that list; empty ones are greyed out. Above the grid, Last sync shows how long ago the most recent crawler run finished. A link at the bottom shows the number of sync log entries and opens the sync log.
Feature status row
Once data is loaded, three status cards summarise the optional features, each with a coloured dot (green = active, amber = needs attention, grey = not configured):
- Risk Scoring — whether an LLM is configured and how many entities have been scored. Clicking it opens Admin → Risk Scoring.
- Certifications — how many access-review decisions have been imported.
- Crawlers — how many crawlers are configured and whether any job is running right now. Clicking it opens Admin → Crawlers.
Links, version, and support
The bottom row has three cards: Resources (website, documentation, GitHub,
license, releases), Version (the running version, with a "What is new" link to
the changelog), and Need support? (a link to report a bug or request a
feature). A banner appears above
everything if your docker-compose.prod.yml is outdated, with the command to
re-download it.
When there's no data yet
On a fresh install the Loaded-data panel shows an empty state with a Configure a crawler → button that takes you to Admin → Crawlers. From there you can connect Entra ID, upload CSV exports, or click Load Demo Data to explore with synthetic data. See the Quick Start for the end-to-end first-run flow.
Load error vs. empty database
An empty database and a failed load look different on purpose. If the dashboard can't reach the server it shows a red "Couldn't load the dashboard" card with a Retry button — and deliberately does not show the onboarding CTA, so a transient error is never mistaken for lost data.