Your first 15 minutes
You have Identity Atlas running with demo data. This page takes you from "there is a grid on my screen" to "I have found something someone should fix" — which is the only demonstration that actually means anything.
Nothing here is a Capture the Flag answer. This is the method; the flags are the exam.
What you need first
- Identity Atlas running with the demo data loaded — see Quick Start.
- The vocabulary from The words you need first. If account (which this product calls a principal), resource, assignment and Direct / Indirect / Eligible mean nothing to you yet, spend eight minutes there. The rest of this page will not land otherwise.
Step 1 — Land, and ignore most of it
Open the app. You land on the Dashboard: counts, a risk summary, a force-directed graph of your data.
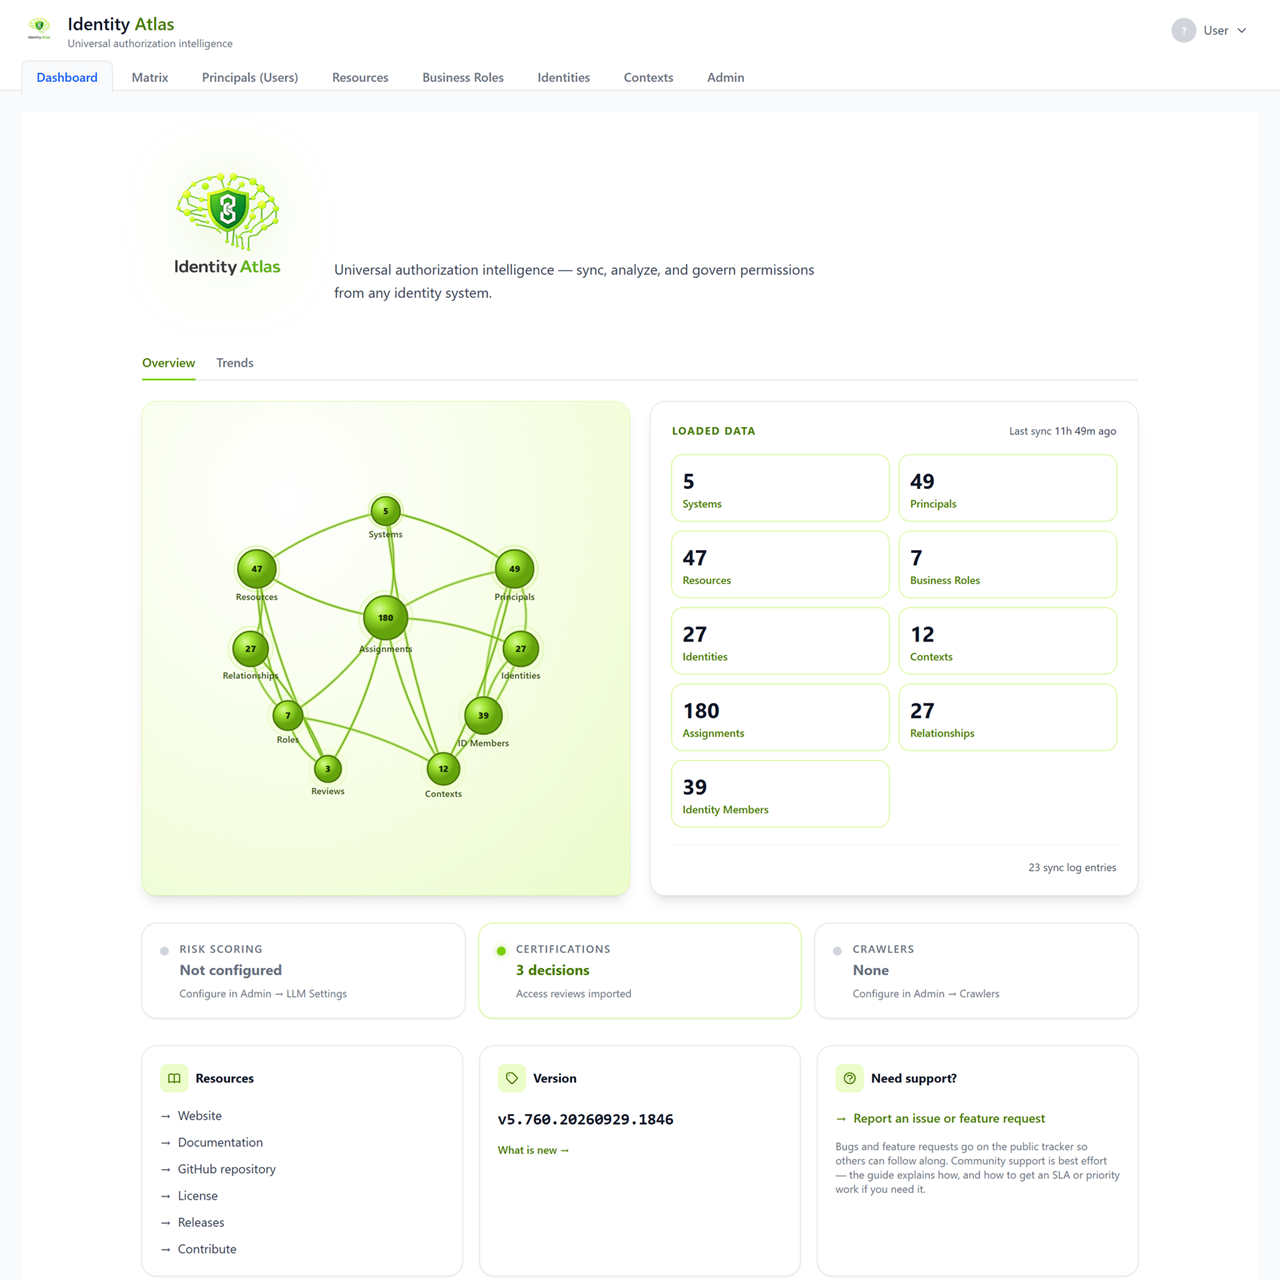
Look at it for ten seconds and then leave. The dashboard is a status board, not an answer machine. Nobody has ever found anything interesting there.
Across the top you have Matrix, Principals (Users), Resources, Business Roles, Contexts and Admin. Two more — Identities and Risk Scores — appear only when account linking and risk scoring are switched on, so do not worry if you cannot see them.
Click Matrix.
Step 2 — Ask a question, not for "the data"
The matrix does not show you everything, on purpose. A grid of every account against every resource is unreadable and, worse, unaskable.
So you start by choosing what is in it. That choice is the scope, and you build it in the filter wizard, which has three steps:
- Setup — what kind of subject you are looking at, and which way round the grid runs.
- Subject conditions — which people or accounts are in it.
- Resource conditions — which resources are in it.
Each step shows you a live count, so you can see the grid getting smaller as you narrow it.
Scope the subjects to a single department. Engineering is a good one to practise on: small enough to read in one screen — and deliberately not the department the Capture the Flag questions live in, so you are not spoiling your own exam.
What you should now be looking at: a handful of people down the left, the resources they hold across the top, and a cell wherever a person holds a resource.
Step 3 — Read one cell properly
This is the skill. Everything else is a variation on it.
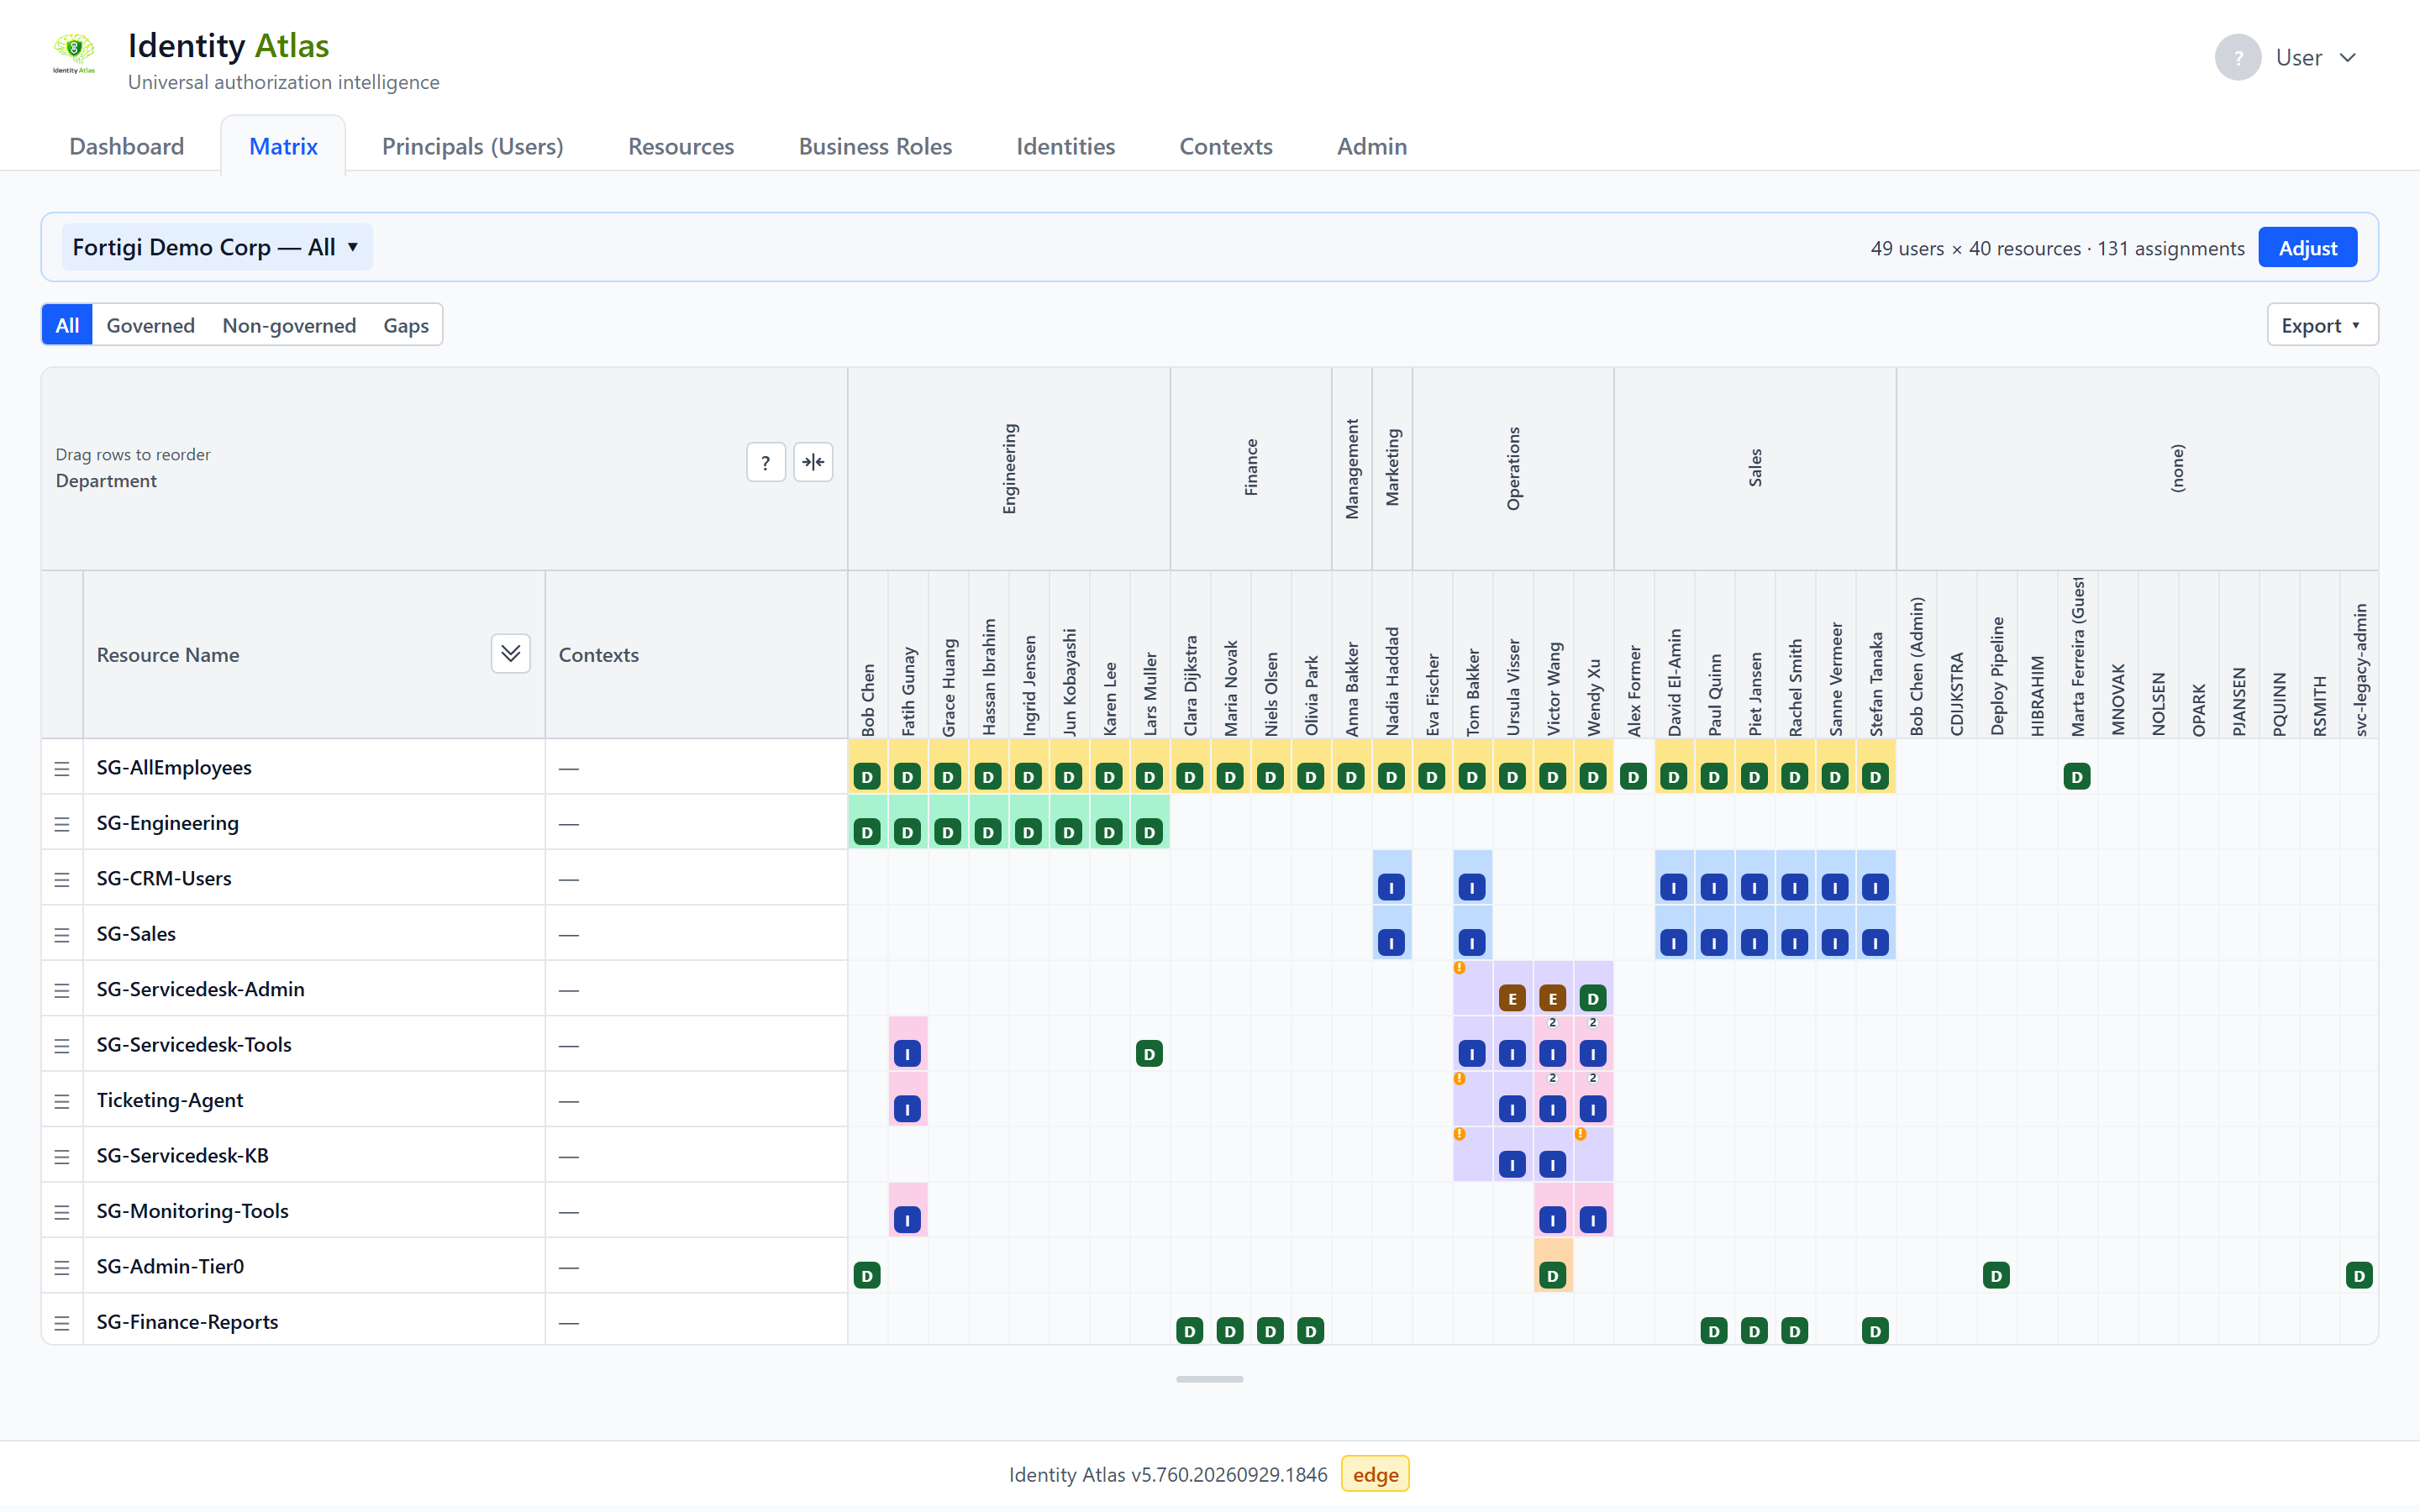
A filled cell means this person holds this resource. The badge in the cell says how:
| Badge | Meaning | What you should think |
|---|---|---|
| Direct | Somebody granted it to this person, individually | Who decided that, and when? |
| Indirect | They inherited it — through a group, or through a role they hold | Then the interesting object is the role, not the person |
| Eligible | They can activate it but have not | This is access nobody is reviewing |
Pick one person, pick one cell, and answer the question "why does this person have this?" out loud. If the badge says Indirect, the honest answer is not "because they are in Sales" — it is "because they hold a role, and that role contains this group."
That distinction is the entire product. A raw export tells you the cell is filled. Identity Atlas tells you who to go and talk to.
Step 4 — Compare intent with reality
Now the useful move.
The matrix can show you only governed access, or only ungoverned access:
- Governed — granted by a business role or an access package. Someone designed this.
- Ungoverned — granted directly to a person. Someone did this.
Flip between the two on the same scope and watch which cells vanish.
What is left when you show only ungoverned access is the honest inventory of everything nobody planned. In a real tenant that view is uncomfortable. In the demo data it is instructive: you can see at a glance which access a role actually grants, and which access people simply accumulated.
The two questions worth asking here
- Something almost everyone in this department holds directly — should the role grant it instead? That is role mining, and you just did it.
- Something only one or two people hold — is that a leftover? People change jobs; their access rarely changes with them.
The second question finds more problems than the first — and neither answer is ever automatic. A resource that looks like a role candidate can be one that department should not have had in the first place. Deciding which is which is judgement, not a query.
Step 5 — Follow a person across systems
Go to Principals (Users) and open someone.
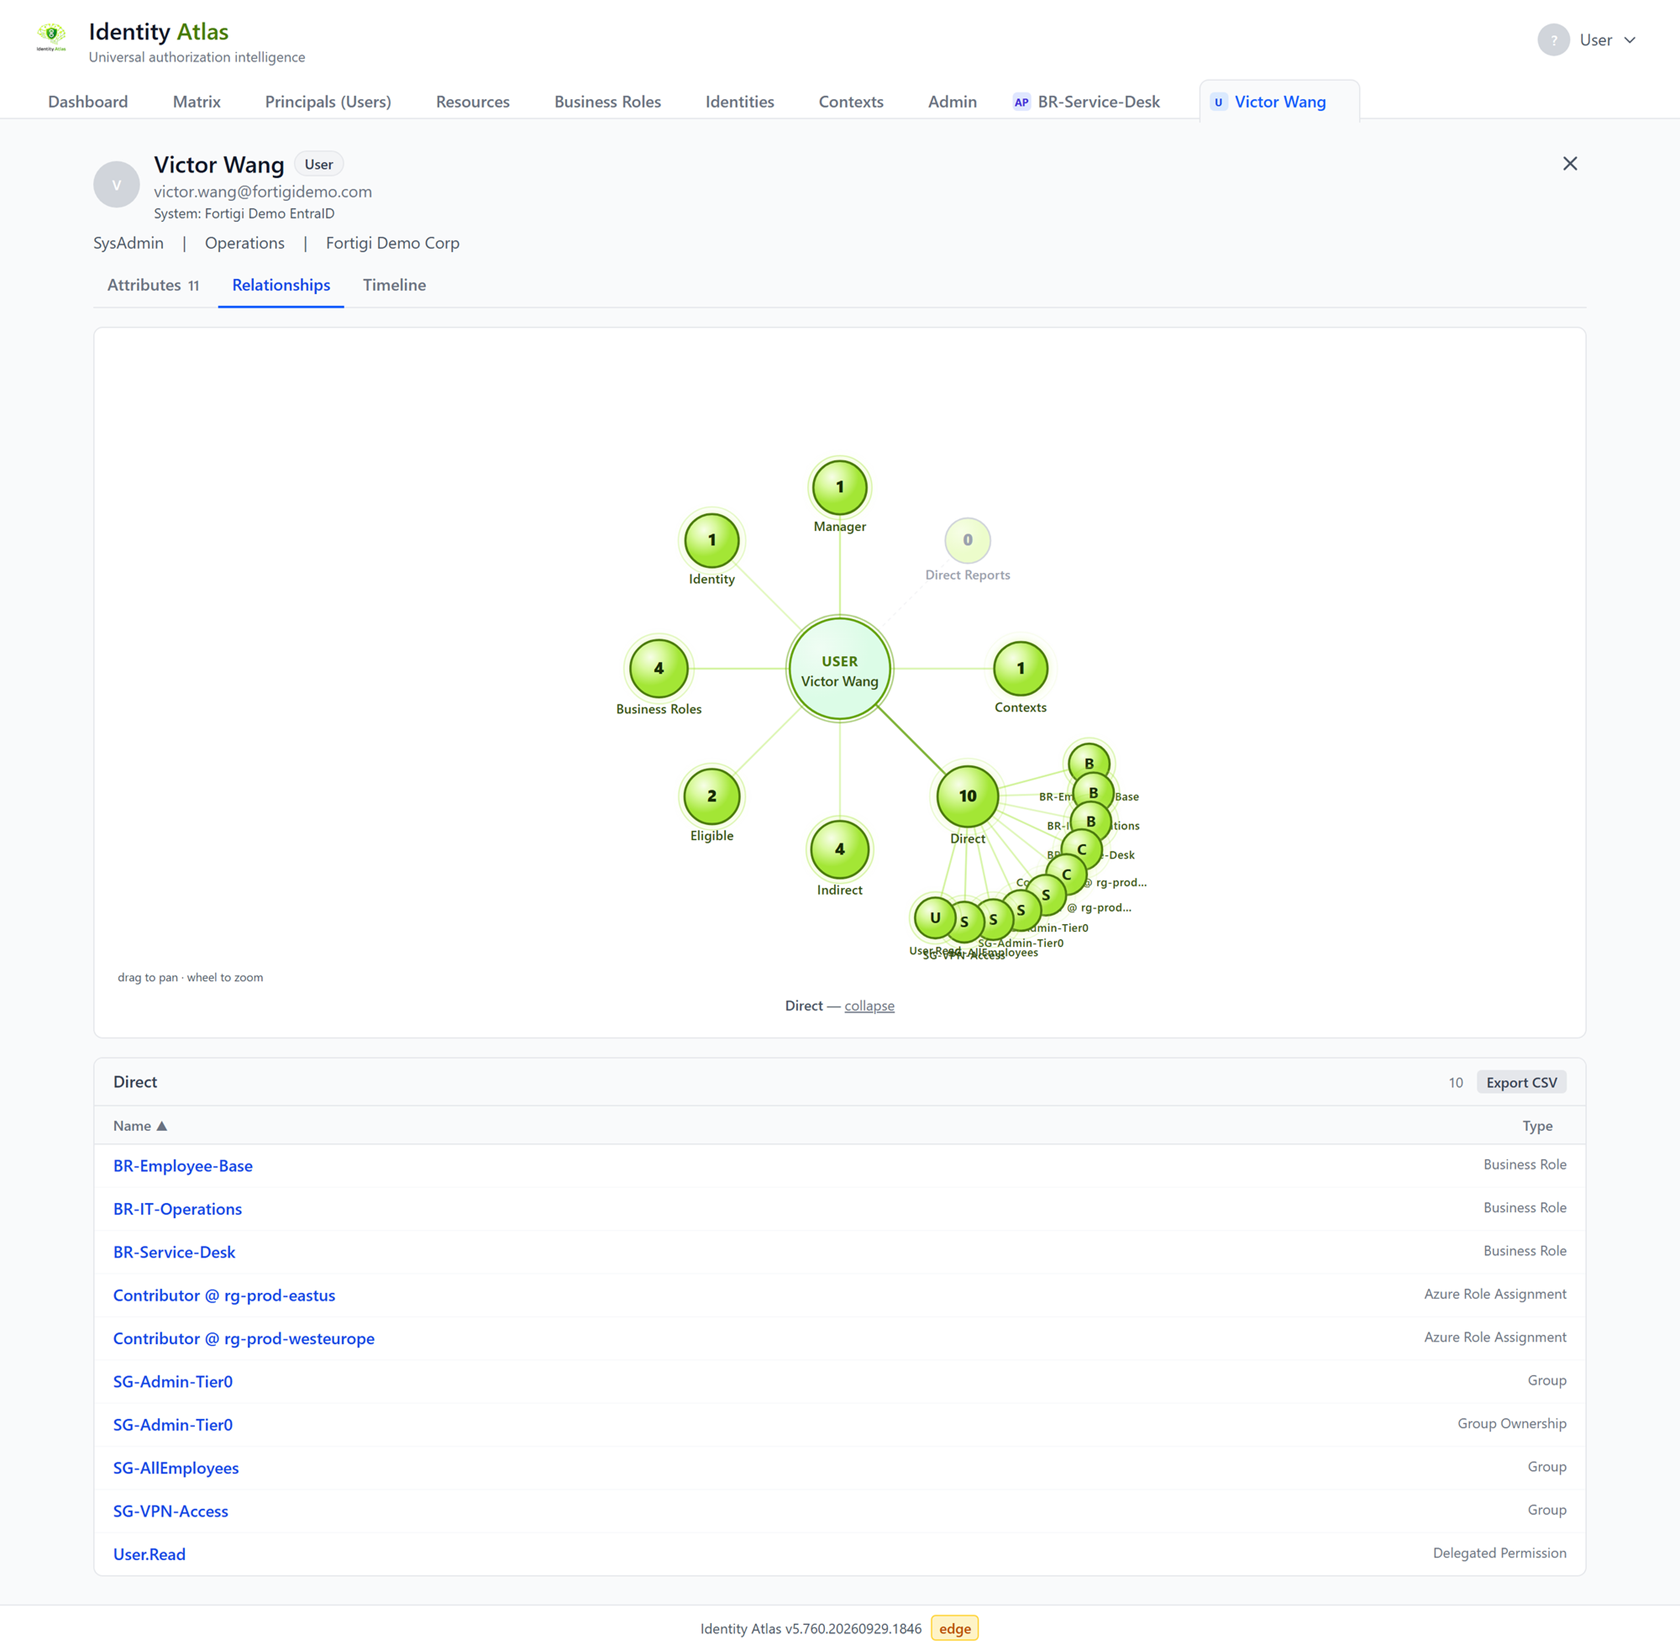
You are looking at one account in one system. Note what the page cannot tell you: an SAP account does not know which department its owner works in. An Azure account does not know their manager.
If account linking is enabled, the Identities tab holds the other half — the person, with every account of theirs attached. That link is what turns "an account list per system" into "what can this human actually do?", and it is why the model separates the two.
Step 6 — Now go and be wrong about something
You can read a cell, tell inherited access from granted access, and separate what was designed from what merely happened. That is genuinely most of it.
Test it properly:
- Capture the Flag — twelve questions in the demo data, rising from "count these people" to "combine three signals from three screens." No login, no tracking, an honour system and an answer key.
- Not sure you are ready? Before you play is the six-idea primer, written for exactly this moment.
When you want to go deeper
| You want to… | Go to |
|---|---|
| Understand the model behind the grid | Data Model |
| Group things your own way, or let an algorithm find groupings | Contexts |
| See access after every inheritance hop | Effective Access |
| Point it at your own tenant instead of the demo | Entra ID |
| Understand the risk numbers | Risk scoring |